Before Windows Server 2016, the alerting and the monitoring of the cluster were managed by monitoring tools such as System Center Operations Manager (SCOM). The monitoring tool used WMI, PowerShell scripts, performance counters or whatever to get the health of the cluster. In Windows Server 2016, Microsoft has added the Health Service in the cluster that provides metrics and fault information. Currently, the Health Service is enabled only when using Storage Spaces Direct and no other scenario. When you enable the Storage Spaces Direct in the cluster, the Health Service is also enabled automatically.
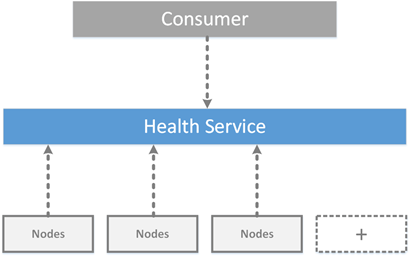
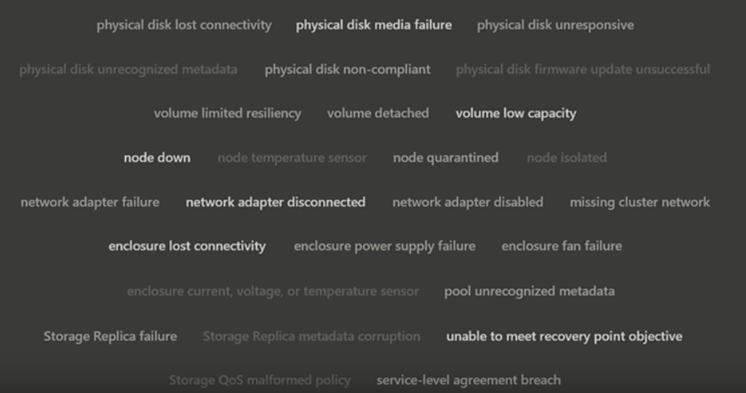
The health service aggregates monitoring information (fault and metrics) of all nodes in the cluster. These information are available from a single point and can be used by PowerShell or across API. The Health Service can raise alerts in real-time regarding event in the cluster. These alerts contain the severity, the description, the recommended action and the location information related to the fault domain. Health Service raises alerts for several faults as you can see below:
The rollup monitors can help to find a root cause of a fault. For example, in order that the server monitor is healthy, all underlying monitor must be also healthy. If an underlying monitor is not healthy, the parent monitor shows an alert.
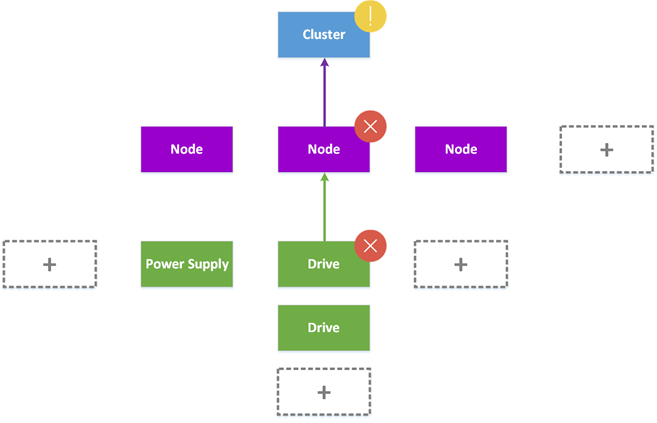
In the above example, a drive is down in a node. So, the Health Service raises an alert for the drive and the parent node monitor is in error state.
In the next version, the Health Service will be smart. The cluster monitor will be “only” in warning state because the cluster still has enough node to run the service and after all, a single drive down is not a severe issue for the service. This feature should be called severity masking
The Health Service is also able to gather metrics about the cluster such as IOPS, capacity, CPU usage and so on.
Use Cluster Health Service
Show Metrics
To show the metrics gathered by the Health Service, run the cmdlet Get-StorageHealthReport as below:
Get-StorageSubSystem *Cluster* | Get-StorageHealthReport
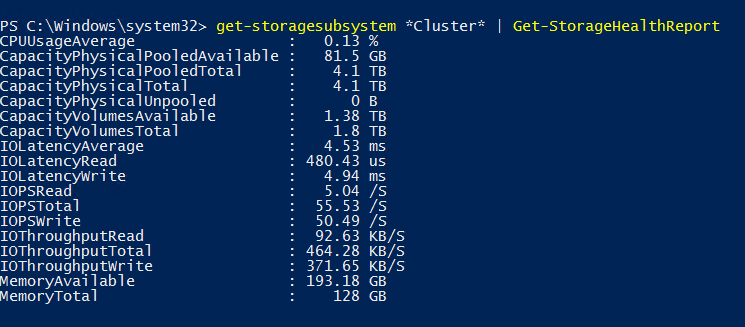
As you can see, you have consolidated information as the memory available, the IOPS, the capacity, the average CPU usage and so on. We can imagine a tool that gather information from the API several times per minute to show charts or pies with these information.
Show Alerts
To get current alerts in the cluster, run the following cmdlet:
Get-StorageSubSystem *Cluster* | Debug-StorageSubSystem
To show you screenshot, I run cmdlet against my lab Storage Spaces Direct cluster which is not best practices. The following alert is raised because I have not enough reserve capacity:

Then I stop a node in my cluster:
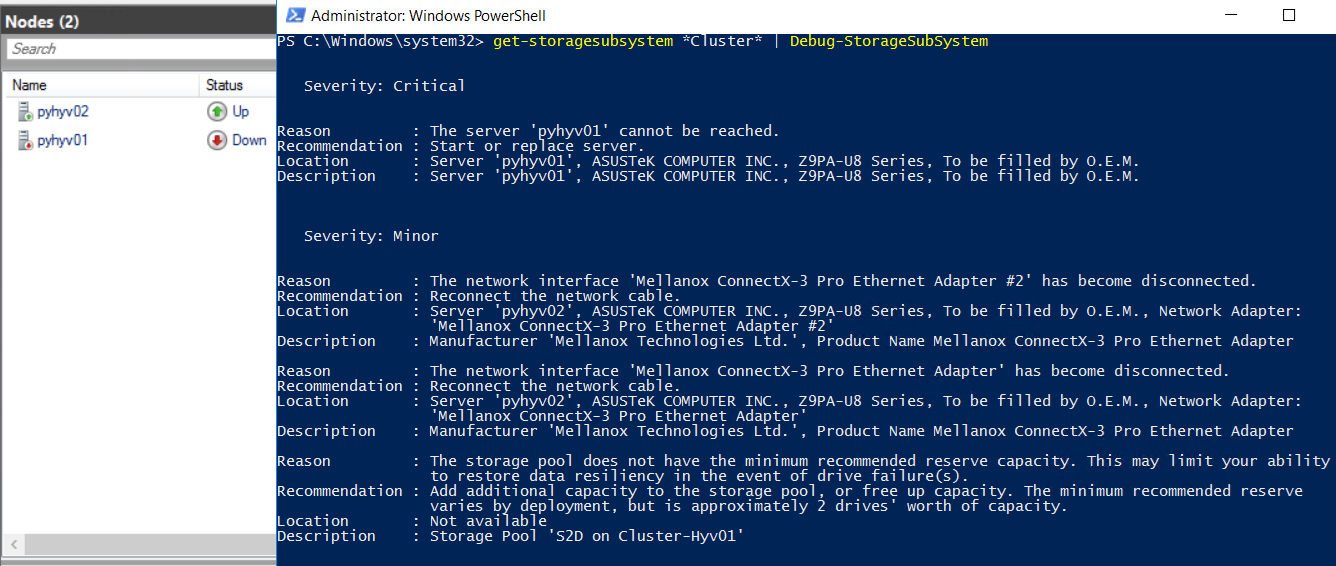
I have several issues in my cluster! The Health Service has detected that the node is done and that some cables are disconnected. It is because my Mellanox adapters are direct attached to the other node.
SCOM Dashboard
This dashboard is not yet available at the time of writing but in the future, Microsoft should releaser the below SCOM dashboard which leverage the Cluster Health Service.

Another example: DataOn Must
DataOn is a company that provides hardware which are compliants with Storage Spaces (Direct). DataOn has also released dashboards called DataOn Must which are based on Health Service. DataOn Must is currently only available when you buy DataOn hardware. Thanks to Health Service API, we can have fancy and readable charts and pies about the health of the Storage Spaces Direct Cluster.


I would like thanks Cosmos Darwin for the topic review and to have left me the opportunity to talk about severity masking.


Hi Romain,
Question: When I do a Get-Virtualdisk on my cluster, everything comes back ok. When I do Get-Volume 2 of my 3 Volumes report they are warning under the column “HealthStatus”, how can I get a report or information of where this warning is about.
I have a 3 node cluster and when rebooting a node (after pause / drain) I lose an enire virtual disk. I’m trying to find out how this is possible. Disks are mirror and should survive a clean reboot.
Hi,
Run Get-StorageSubSystem | Debug-StorageSubSystem. You can also run Get-VirtualDisk | Repair-VirtualDisk.